Measurabl is thrilled to announce the launch of our new comparative analytics tool that empowers users to instantly compare the performance of their buildings to their peers.
Cohort Insights is a customizable way to unlock actionable insights about your buildings’ energy and water usage as well as carbon emissions to help you better understand and improve building performance. Get to know the new feature that will help power your ESG (environmental, social, governance) management decisions.
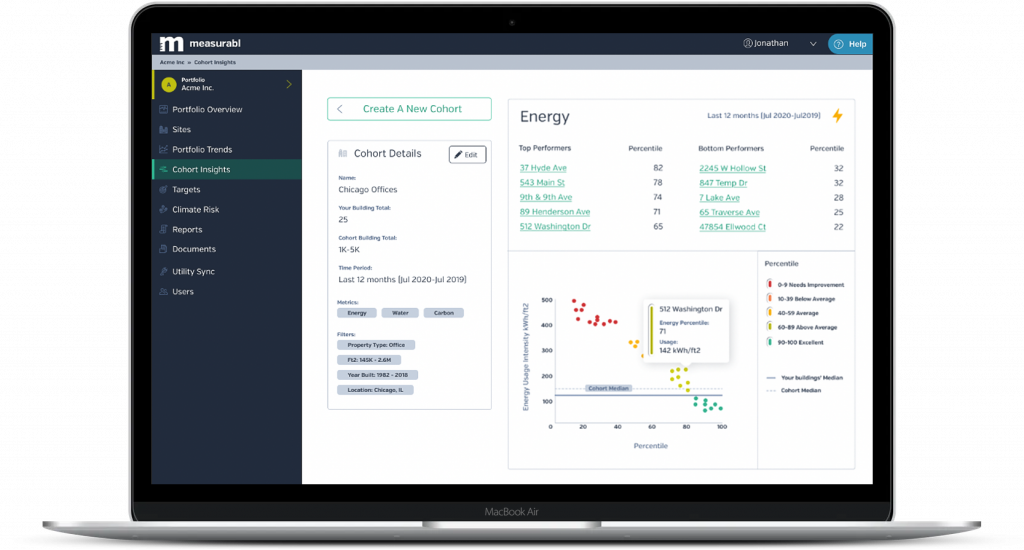
What is Cohort Insights?
Cohort Insights is a new tool that empowers real estate owners and operators to compare the energy, water, and carbon performance of their buildings to a peer group of their choosing. Peer groups, also known as cohorts, can be defined by on building type, size, location, year built, and data coverage.
Energy, water, and carbon percentile rankings are generated for each building based on the building’s usage relative to the features of that building. A building energy percentile rank of 90 tells you the building outperformed 90% of the buildings in the cohort you defined, while a building water percentile rank of 40 tells you the building only outperformed 40% of the cohort. Learn more about the methodology behind this ranking.
Why did we build a peer benchmarking tool?
Existing tools for measuring ESG performance are complex, one-size-fits-all, and do not provide timely, dynamic insights. These tools often only give real estate professionals the ability to compare their portfolio with dated annual benchmark surveys and reports. Sometimes the benchmarks are created from sample survey data, while others are compared using estimates and assumptions. What’s more, the preparation required for benchmarking can take months.
Commercial real estate companies and their stakeholders need to measure and understand portfolio performance in a way that is transparent, timely, and flexible. Here’s why Cohort Insights is different:
On-demand Building Performance Insights
There is no such thing as “reporting season” with Cohort Insights. You can create comparisons on the key metrics that are material to your organization and export results whenever you need them: for quarterly reports, investor meetings, corporate ESG disclosures, and more.
Customizable Comparisons
Benchmark your buildings based on factors that are material to your organization. You can compare your assets’ performance to similar buildings based on time of year, metrics (energy, water, carbon), and create peer groups by location, property use type, year built, size, and data coverage.
How does Measurabl calculate the percentile rankings?
Measurabl’s proprietary methodology pulls in distinctive characteristics of each of your buildings to create an efficiency percentile. Measurabl uses machine learning to provide improved efficiency metrics, normalized for use type, weather, and seasonality.
We’ve developed a data science model that uses building data from Measurabl’s vast database to calculate the typical baseline usage for each building. This baseline usage can be thought of as the most likely usage based on a few commonly available attributes:
- Building use type
- Floor Area
- Degree Days (Heating and Cooling)
- Primary meter mode for each usage type (tenant paid, landlord paid, common area, and/or exterior)
- Month of data capture
- Year built
To calculate percentile ranks from those baseline usage predictions, we use the ratio between the actual recorded usage and the predicted baseline usage to rank the performance from 0 to 100.
How is Data Coverage Calculated?
Data coverage can be thought of as a weighted ratio that assesses the meter data you have (also known as meter data completeness) compared to the total data you could have based on floor area over a given timeframe. As an example, a multifamily building owner may only have access to common area meter data that accounts for 25% of total floor area; the remaining 75% of the floor area may be in residential spaces where tenants control their own utility data. If a building in Measurabl is not allocated by spaces, the data coverage is the average meter data completeness of all building-level meters over the selected time frame.
For each meter and a given timeframe (e.g. last calendar year), we consider the number of months of meter data present for each meter out of the total number of months in the timeframe (e.g. 12 months), to calculate a meter-level data completeness. Whole building-level meters and common-area meters are allocated to spaces by floor area.
Who should use this tool?
Cohort Insights is designed for real estate owners who want to measure the performance of their buildings relative to peers so they can take actions to improve them.
For Measurabl customers, Cohort Insights is available to Portfolio Managers, Portfolio Members, Subgroup Managers, and Subgroup Members through the Premium Subscription Tier. Contact your Account Manager for more information.
When can I try this new tool?
Cohort Insights is now live! You’ll see new improvements over the next few months as we add new functionality.
What is the difference between Measurabl’s Peer Benchmark and Cohort Insights?
We realized our old Peer Benchmark was not giving customers the insights they needed to make actionable improvements to their buildings. Cohort insights has an improved, more transparent methodology and a more customized approach to benchmarking buildings. We’re using new machine learning models. Expected usages are calculated at the space level for energy and carbon metrics, whereas the Peer Benchmark looked at building-level expected usages for the energy and carbon metrics.
The Measurabl Peer Benchmark will be removed from the application in early 2021.
How do I know my data is private?
Your specific, identifiable building data is never visible outside of your organization. Cohort Insights has set thresholds for the minimum number of buildings allowed in a cohort and the minimum number of buildings owned by others allowed in a cohort. This ensures other users will never be able to identify your buildings. Unless you choose to create a cohort of only buildings inside your portfolio, Cohort Insights will not show the exact size of a cohort—instead, cohort sizes are displayed in ranges, such as 100-499 Buildings or <100 Buildings. To learn more about Measurabl’s privacy policy, including our compliance with GDPR, please review our documents and contact us with any questions.
If you have additional questions, please contact info@measurabl.com and we’ll be happy to help!