Get a top-level view of your overall ESG performance across your portfolios and subgroups
When you’re managing a multi-fund portfolio, it can be challenging to identify the top and bottom performers across all of your assets. However, this is a crucial step toward improving your ESG performance—without this visibility, it can be difficult to determine where to allocate funds and resources toward improvement projects.
To help owners get a better vantage point, we’ve developed CrossView, a new tool that enables you to “zoom out” and see top-level ESG performance indicators across all of your portfolios and subgroups in Measurabl.
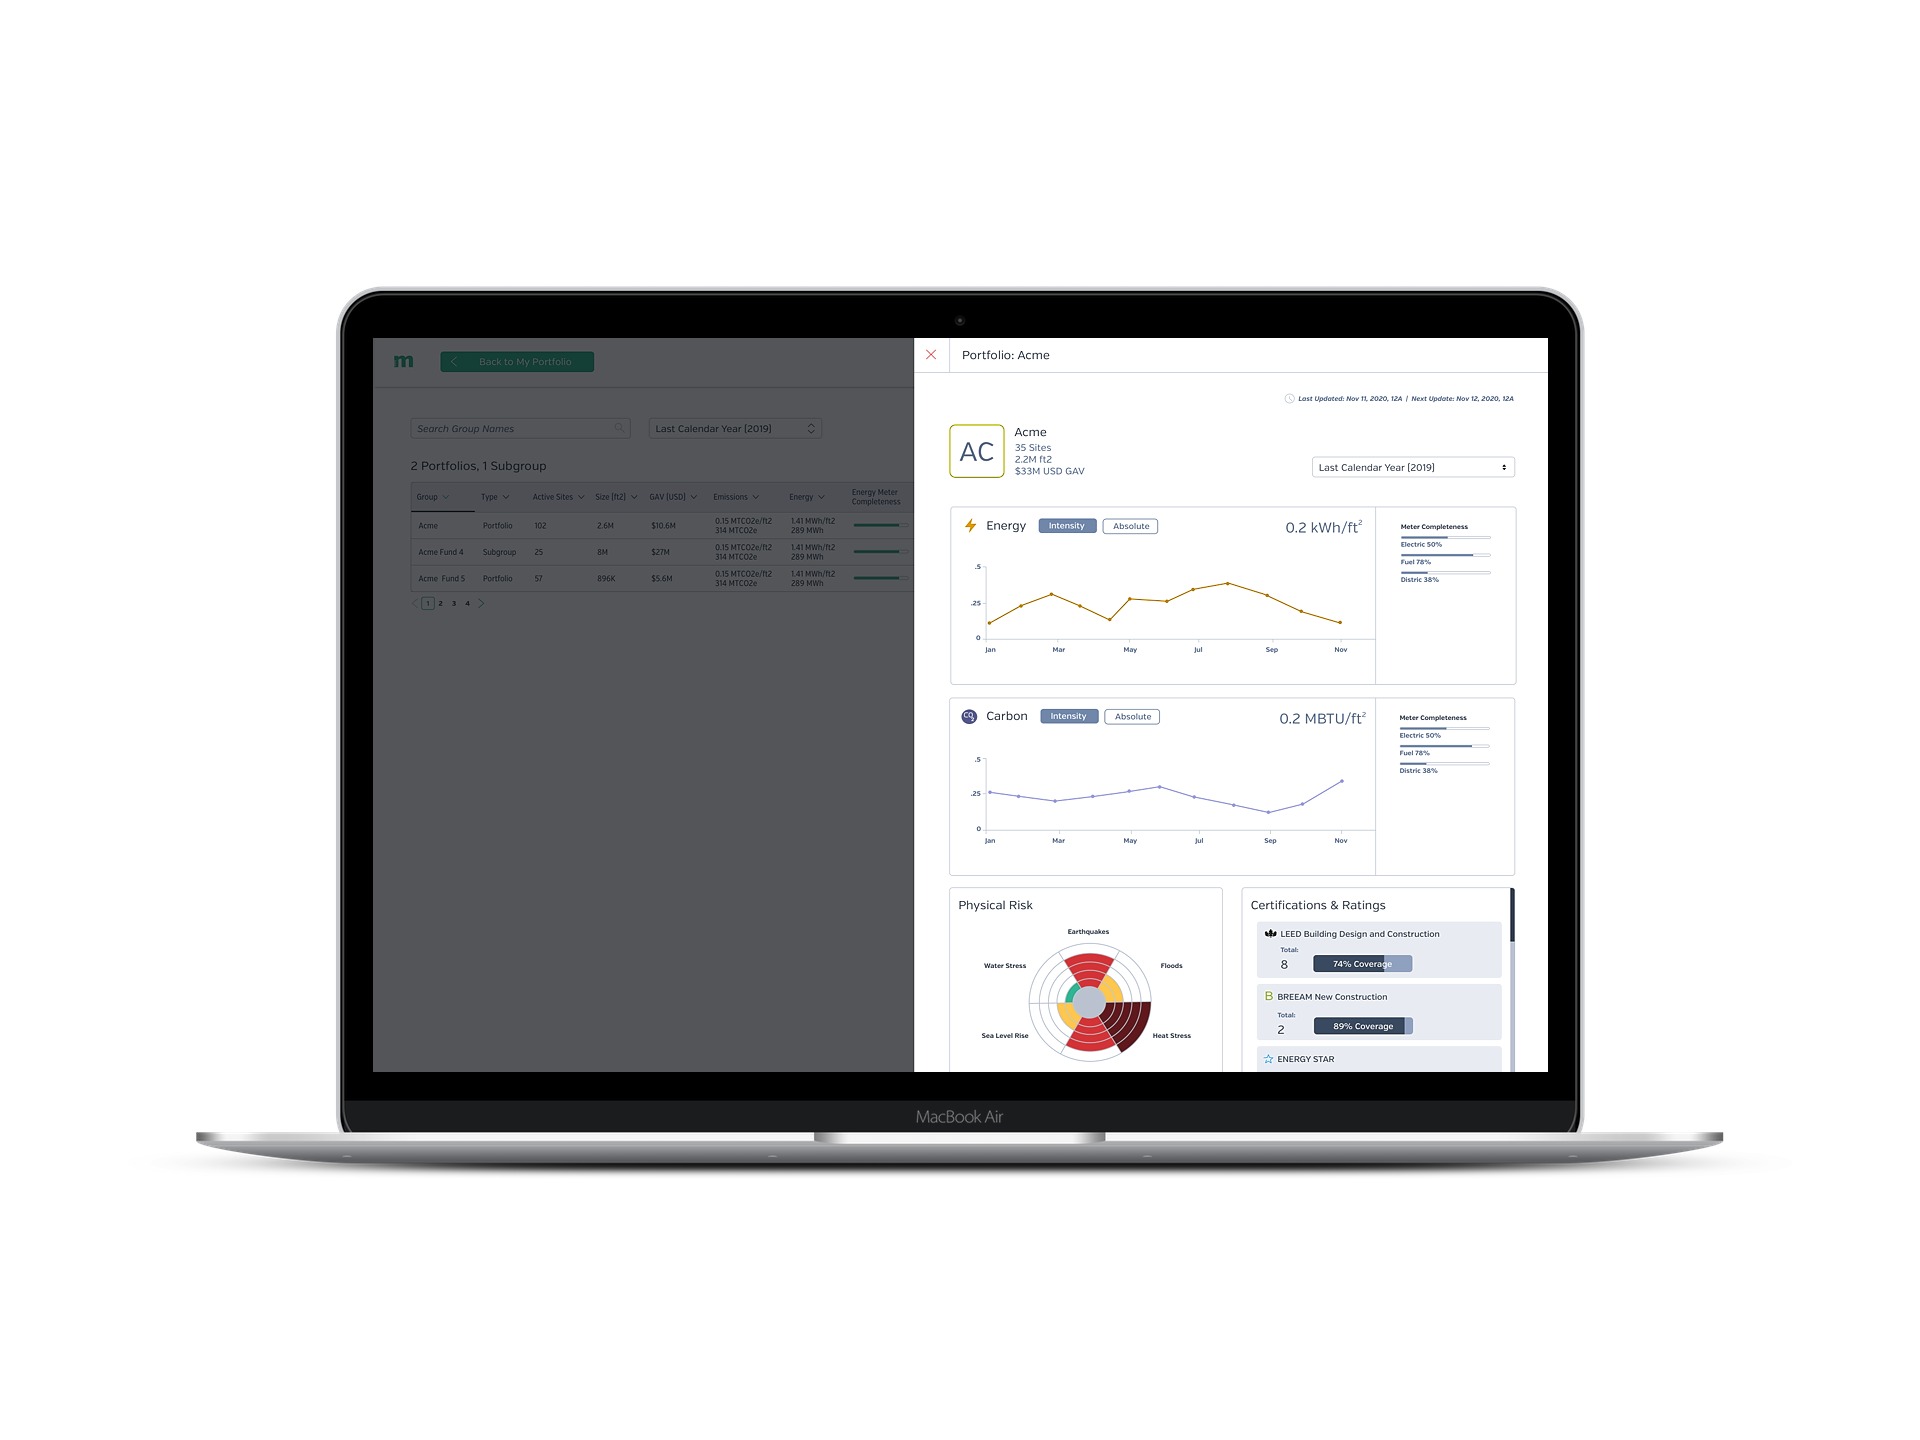
Whether you’re working with multiple portfolios, or you have a complex portfolio that’s been divided into funds, geographic regions, and property teams, CrossView provides a unified look at your ESG metrics so you can easily spot data collection quality issues and identify buildings that need the most improvement.
CrossView displays meaningful performance indicators from each portfolio and subgroup, including:
- Energy and water usage, meter completeness, and carbon output
- Physical climate risk (for PCRX customers)
- Certification and rating status
- Project status, spend, and expected savings
You can also view metrics for a selected time period so you can determine whether subgroups are falling behind on data collection as you prepare for your annual report.
From this high-level view, you can examine funds and their assets to view more granular data and investigate the source of performance or data collection problems without ever having to leave the page and lose your place.
Schedule a demo with our team or contact your Customer Success Manager today to learn more about CrossView and other innovative features in Measurabl.