In an uncertain landscape where policy shifts and market forces collide, data brings clarity—and the data shows real sustainability progress is underway.
This is a first look at Measurabl Intelligence (Edition 1) our new data-driven report series tracking energy and carbon trends across global real estate, starting with the U.S.. In this preview, we spotlight the findings—introducing the analysis, highlighting key takeaways, and setting the stage for what’s to come.
This inaugural report is just the beginning. Future editions will explore the confluence of factors that influence industry-wide energy and carbon trends. Dive into the first few sections to see how the built environment is progressing—measurably—toward a more sustainable, profitable future.
Real Estate’s Decarbonization Journey: Insights from Measurabl’s Groundbreaking Sustainability Data
The real estate industry, responsible for 42% of global CO₂ emissions—27% of which come directly from building operations—is at a critical turning point.¹ Economic volatility, shifting regulations, and evolving investor expectations are driving urgency to align sustainability goals with business realities.
The industry faces urgent questions: How much progress toward decarbonization has been made? Is it fast enough? And what comes next?
As the world’s leading sustainability data and software platform for real estate, we’re introducing Measurabl Intelligence—a new report series designed to help answer these questions by leveraging our expansive global dataset.
This first-of-its-kind longitudinal study of Measurabl space-level data—developed by our data science team— offers a new level of visibility into industry progress and sustainability performance across the U.S. Grounded in timely, granular, measured performance data, Measurabl Quantum is unrivaled in the breadth and depth of its sustainability data repository. Our analysis explores energy use and carbon emissions intensity trends across seven U.S. property types from 2019 through September 2024.
The findings are clear: measurable progress is happening.
Our analysis shows sustained declines in energy use intensity and carbon emissions intensity across the property types analyzed. The global push toward net zero by 2050 demands accelerated action. While some property types and regions are making strides, others face a steeper climb.
This report marks the start of a global, data-driven series on real estate’s sustainability transformation, starting with the U.S. It establishes “the what”—showing where progress is being made and where gaps remain. Future editions will expand into Europe and beyond to uncover the “why”—analyzing key drivers of change and their broader impact. As the industry navigates an uncertain landscape, our role is to measure what matters, using objective metrics to bring clarity to the conversation. We welcome partnerships with industry leaders and academic institutions to further enrich our dataset and augment future analyses. With every new customer and partner, our global dataset expands, providing richer insights, more accurate ben
chmarks, and greater value for those who rely on Measurabl.
This initiative is both a snapshot and a call to action, empowering the industry to seize this unique moment. It is also an invitation to engage in the conversation, gain and share insights, and collectively drive urgent transformation to a profitable, sustainable built environment.
How Energy and Carbon Metrics Reveal Real Estate’s Sustainability Performance
Within a market flooded with disparate standards and proxy metrics, energy use intensity and carbon emissions intensity—referred to as “energy” and “carbon” in the report—stand out as accessible, measurable indicators of building performance. Energy and carbon management are now key drivers of risk and reward in real estate, directly linking sustainability efforts to efficiency, cost savings, and asset value.
We explain our full analytical approach in section 3 and provide the detailed methodologies in the Analysis and Appendix sections. In short, our method calculates cumulative percentage changes from 2020 to 2024 relative to a 2019 baseline. We examine median shifts by property type to track evolving patterns and identify lasting structural trends versus short-term anomalies. This section provides a preview of what we found.
We also offer an early look at the broader factors that could be influencing sustainability trends, setting the stage for deeper exploration in future reports.
U.S. Sustainability Performance Since 2019
Energy
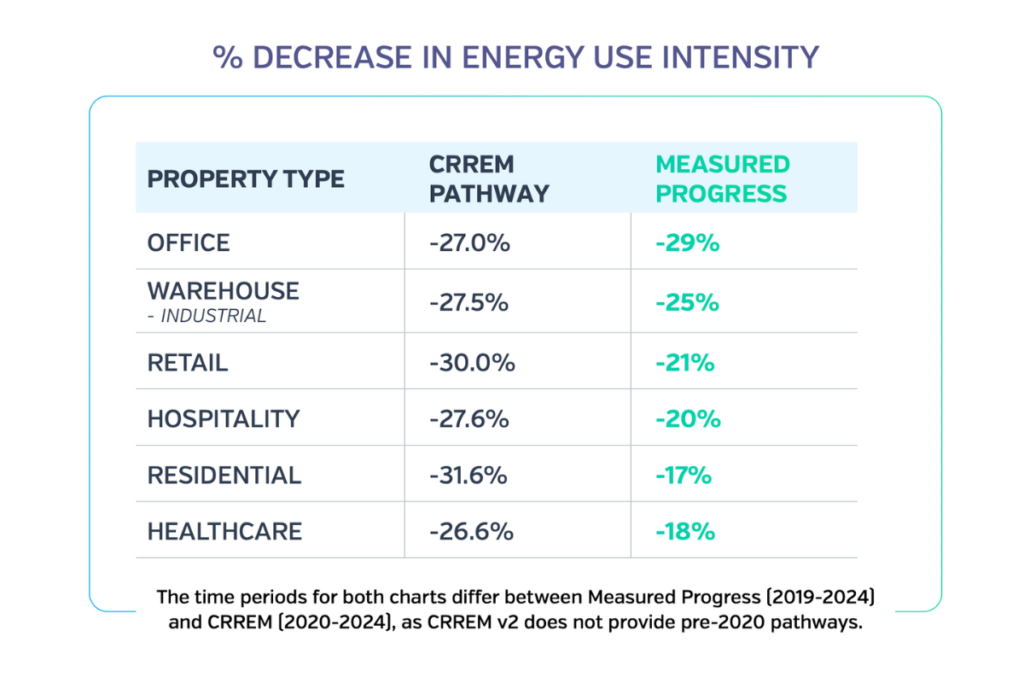
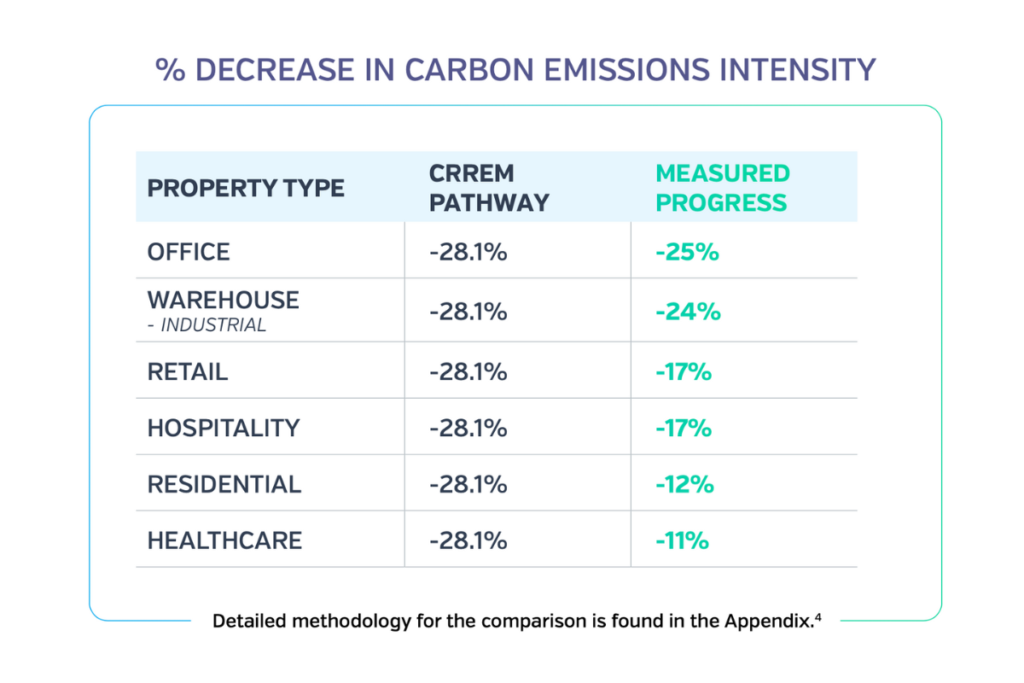
Although COVID-19 initially caused drops in energy use, followed by a brief upturn, the data now reflects a sustained downward trend across both energy and carbon, suggesting strong structural shifts. Our dataset shows consistent declines across both measures, all trending below pre-COVID benchmarks. Energy reductions range from 5% to 25%, while carbon reductions vary between 14% and 29%.
The pace of progress varies by property type and region, influenced by a range of factors. Offices, analyzed in more detail at the state level later, saw the greatest cumulative decline of 25% from 2019 EUI levels. Industrial warehouses follow closely at 24%, while retail, hospitality, and residential sectors experienced moderate cumulative declines of 17%, 17%, and 12%, respectively. Industrial manufacturing, at 5%, lagged behind, highlighting the challenges of decarbonizing energy-intensive operations.
Carbon
Notably, carbon reductions, following a consistent downward trajectory, are outpacing energy efficiency improvements by 4 to 9 percentage points, depending on property type, suggesting the growing impact of power grid decarbonization and renewable energy integration.
Variation in energy usage reductions at the state and city level is likely shaped by a range of interacting factors—regulations, building maturity, tenant behavior, and climate risks, to name a few—that interact in complex ways. Together, this confluence underscores the business case for sustainability, where success is driven not just by compliance, but by how these interconnected forces create opportunities for operational efficiency, improved financial performance, and long-term resilience. They also underscore the critical need for tailored strategies by property type to accelerate progress.
Key Findings At A Glance
- Energy has steadily declined across all seven property types, with offices seeing the steepest cumulative decrease of 25% between 2019 and 2024.
- Carbon trends decline even faster than energy usage due to various factors, including the greening of the grid.
- At the state level, cumulative declines in energy usage range from 14%-22%, with some states showing twice as much progress in declines than others.
- Differences in energy usage at the city level reflect significant variation (2%-22%), indicating some cities have made 10 times greater progress than others, over the same time period.
- State level energy reductions are wide ranging in the office sector, where some states saw declines as much as double that of others.
Are Real Estate Emissions Cuts on Track for 2050 Net-Zero Goals?
Despite these gains, the pressing question remains: Is progress happening fast enough to meet global 2050 net-zero targets?
The Commercial Risk Real Estate Monitor (CRREM) provides science-based, decarbonization pathways for the real estate sector, globally. Measurabl performance data shows that gaps persist between the rate at which some property types are decarbonizing relative to CRREM’s science-based targets. While offices and industrial properties are largely on track to meet net zero goals by 2050, other property types, including healthcare, residential, and hospitality, are lagging behind and will require more aggressive reductions to close the gap.
U.S. Progress Against Science-Based Targets
The comparison charts reveal mixed progress toward net zero targets across property types. Offices stand out with carbon reductions outperforming the target (29% vs. 26%), while energy performance is slightly below expectations (25% vs. 26%). Industrial warehouses demonstrate near parity with benchmarks, but other sectors, including retail and hospitality, show moderate gaps. Healthcare and residential lag significantly in carbon reductions, underperforming by over 10 percentage points compared to CRREM targets in energy usage reductions.
Despite varying performance against these benchmarks, all property types in our dataset are making progress amid a turbulent macroeconomic backdrop, with geopolitical disruptions, rising energy costs, and fluctuating interest rates challenging the industry. As global capital markets increasingly prioritize sustainability, real estate is well positioned to navigate these uncertainties. Energy—the most controllable expense in real estate operations—offers clear opportunities for cost savings and portfolio resilience. For investors and lenders, aligning portfolios with sustainability goals boosts asset values, reduces capital costs, and unlocks meaningful tax advantages. The U.S. Green Building Council estimates that retrofits could generate hundreds of billions in tax deductions nationwide—a compelling financial incentive to accelerate efficiency. For tenants, energy-efficient properties lower utility bills and improve working environments, driving both retention and attraction.
But the real story isn’t just in the numbers; it’s in how a unique confluence of megatrends is colliding under a new administration with potential policy rollbacks looming, and how to navigate from there. This isn’t just another list of trends—it’s a behind-the-scenes look at the real forces shaping real estate’s path forward.
Trends Driving Sustainability
- Policy & Regulation: A push-pull dynamic is unfolding between federal rollbacks and local policy momentum, creating both friction and forward movement on decarbonization.
- Occupancy Trends: Shifting workplace dynamics—from remote work to changing space utilization—are redefining energy demand and efficiency strategies.
- Operational Interventions: Smarter buildings, better HVAC, and real-time data are driving energy efficiency gains where it matters most—at the asset level.
- Grid Mix Evolution: The power grid is evolving, with coal and natural gas giving way to renewables, directly influencing real estate’s carbon footprint.
- Climate Volatility: Shifting weather patterns and extreme events are creating new risks and unpredictability in energy consumption, resilience planning, and asset performance.
A Deeper Dive: Uncovering the Key Trends Shaping Real Estate’s Energy and Carbon Performance
The declines shown in the data are likely the result of a convergence of forces reshaping real estate operations, strategy, and financial resilience. These five trends are just some of the quantifiable forces shaping the industry’s trajectory.
How much impact do they really have? Which levers will drive the greatest progress?
Future editions will explore how these factors influence industry-wide energy and carbon trends.
For now, one thing is clear: energy and carbon intensity trends in U.S. real estate have advanced despite economic and regulatory complexity. Rising energy costs, inflation, and sustained high interest rates are straining operating budgets and slowing transactions.
Green financing is unlocking billions in capital for retrofits and efficiency upgrades, while rising energy prices push owners to maximize savings. High-performing, energy-efficient spaces are becoming a competitive advantage as tenants prioritize sustainability commitments. AI and real-time carbon monitoring are transforming energy management and compliance, while grid modernization and renewable adoption reshape energy sourcing and consumption.
Despite both headwinds and tailwinds, our data shows sustained momentum.
Explore What’s Inside: Key Insights, Trends, and Real-World Sustainability Strategies in Real Estate
The rest of the report provides a first-of-its kind look at the data, trends, and real-world strategies shaping the industry. Here’s a sneak peek of what’s inside:
Section 4: Our Analysis & Methodology
What does the rest of the data show? Our analysis reveals how U.S. real estate has adapted to challenges like shifting occupancy, climate risks, and post-pandemic impacts. We break down energy and carbon trends by property type, then zoom in on state and city energy use from 2019 to 2024, with a focus on office performance.
Section 5: Trends Driving Sustainability
Regulations, market shifts, investor pressure—what’s really driving shifts in sustainability? Our dataset highlights progress among tech-enabled, sustainability-driven leaders, but that’s just one part of the story. We explore the broader forces—regulatory changes, market shifts, and evolving demands—and their impact on strategy and financial resilience.
From Insights to Impact: Customer Results
Who is leading the charge in sustainable real estate? We shift from data and megatrends to real-world results, showcasing companies that are using sustainability as a competitive advantage including BXP, Nuveen, and AMLI Residential. These leaders are cutting costs, mitigating risks, attracting tenants, and future-proofing their portfolios. Through sustainability case studies, we highlight how they are turning sustainability into a strategic asset—seizing market opportunities and future-proofing portfolios.
Section 7: Conclusion and Outlook
What will it take to outcompete in 2025 and beyond? Measured sustainability initiatives are now central to value creation and risk mitigation. The future belongs to organizations that embrace technology, collaboration, and transparency. In this section, Measurabl’s leadership reveals the trends that will define success in an ever-evolving market—and why investment-grade data will be the key differentiator between leaders and laggards.
Note: The Appendix includes a full list of report contributors, sources, and detailed methodologies for full transparency.