GRESB Scores are out for the 2017 reporting season. Understanding your overall GRESB Score, however, requires a deeper analysis of the score breakdown to gain full meaning and value. Here are 5 things you need to know:
Know The GRESB Model
GRESB separates its survey into two major data categories: Implementation & Measurement (quantitative, representing 72% of your score) and Management & Policy (qualitative, representing 28% of your score). GRESB has been shifting their scoring mechanism over the past few years, including a change from a quadrant to a quintile rating model. A screenshot of the 2016 GRESB Model is below.
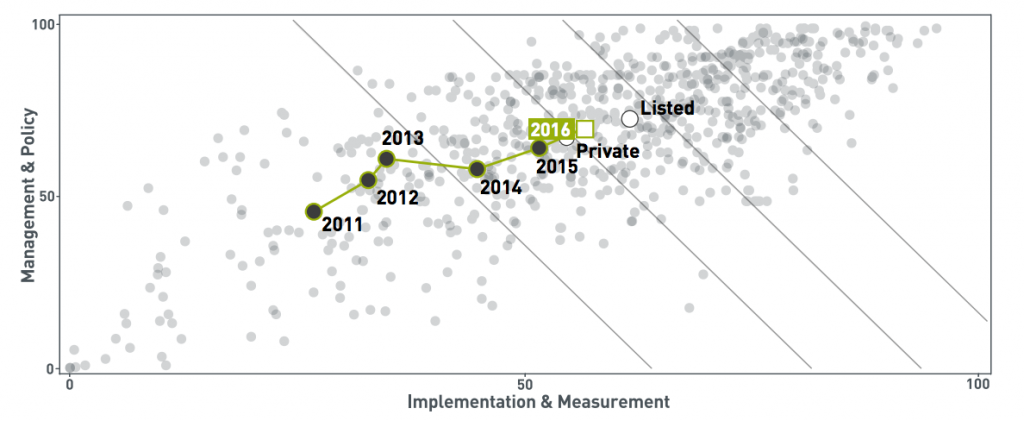
Sound confusing? GRESB must have thought so, too. In 2016, the quadrant-quintile model was simplified to the above, which we expect to carry over to 2017. GRESB continues to step away from the quadrant model and instead pursues the GRESB Rating, which breaks down the entire GRESB universe into quintiles and gives each company a quintile rating from 1-5. Now, the GRESB Rating awards 1-5 Green Stars (formerly reserved for those who fell in the >50 Implementation & Measurement as well as Management & Policy quadrant) based on quintiles compared to all other funds reported to GRESB.
Peer Averages Are Best Indicator Of Performance
GRESB is a one-size-fits-all survey that encompasses environmental, social, and governance (ESG) data, but even this extensive reporting standard cannot accurately reflect how you stack up to your peers. It’s unfair to compare an office portfolio’s score to an industrial portfolio’s score to a multifamily portfolio’s score due to the huge variance in use, available data coverage, leasing structure, etc. This can make your score seem artificially inflated or deflated, depending on portfolio type.
Peer averages are the most important indicator of performance. Compare your score against the peer average for your portfolio type to best understand how your portfolio is doing. From here, it is easiest to understand your true performance.
Scores Weighted by GAV
Not all sections are created – or scored – equally. Some sections are weighted more heavily towards certain property types, while others have a cap on the maximum number of points that your portfolio type can achieve on a particular section.
Performance Indicators and Building Certifications & Ratings sections include all property types, but the overall score is weighted more heavily towards those property types with higher Gross Asset Value (GAV) percentages, according to section RC5.2.
Data Coverage Is the Best Way To Improve Your GRESB Score
You already know that the Implementation & Measurement section of the GRESB survey is 70% of your Score. Data Coverage is a huge component of that portion; in fact, the Performance Indicator section is worth 25% of your overall score.
Automate your data collection or use a central repository system for all of your data that you report to GRESB. This is the easiest way for you to improve your score, instead of using an error-prone manual system. While the portfolio type can greatly affect the amount of data coverage accessible to you, you can still improve your score by collecting the maximum amount.
If data coverage is already high, then your score change may be derived from three factors: data increase or decrease in your year-over-year survey, utilization of renewable energy and reused water during the reported time period, and data coverage relative to your peers.
Analyze Your GRESB Score Breakdown
The GRESB scoring is a bit of a black box; GRESB does not reveal exactly how questions are scored, and the scoring system changes a little every year. GRESB is constantly working to provide the most helpful score, but this can also lead to confusion on the scoring mechanism for the current year. Thus, you’ll need to take a deeper dive into the points breakdown for each section to best understand how you achieved your overall GRESB Score for 2017.
Still unsure? Measurabl has helped report and review hundreds of GRESB surveys, so we can provide an in-depth analysis of how you to improve your score next year.