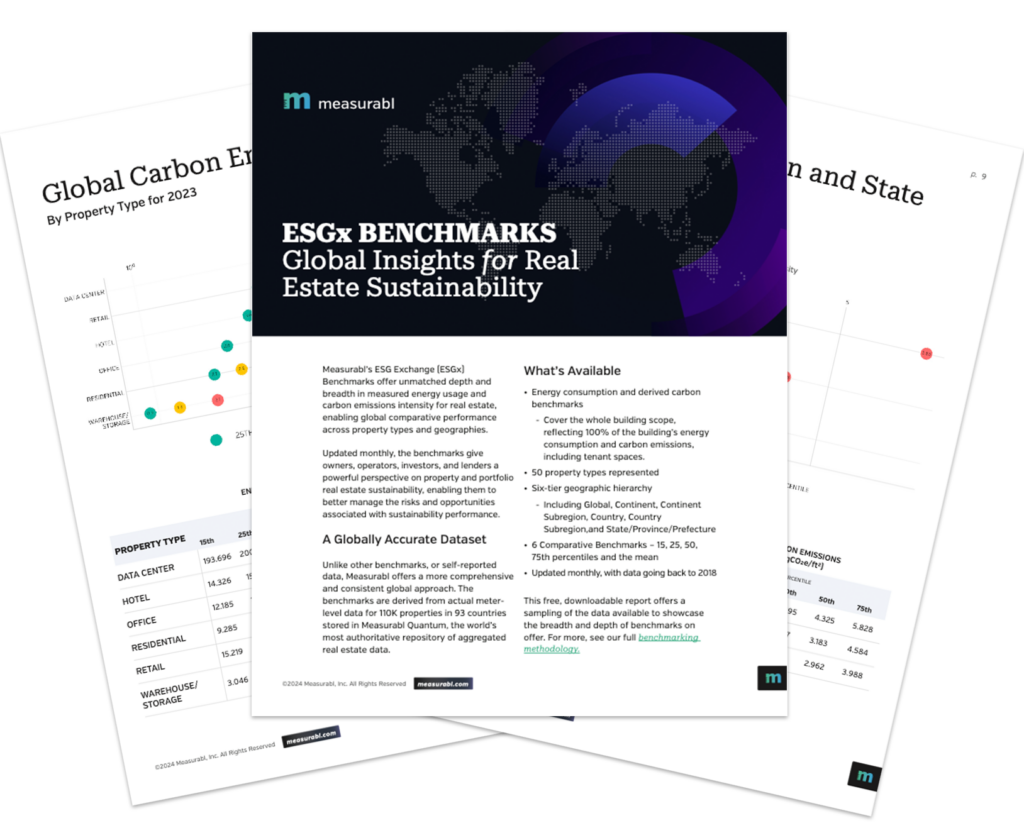
Measurabl’s ESG Exchange (ESGx) Benchmarks offer unmatched depth and breadth in measured energy usage and carbon emissions intensity for real estate, enabling global comparative performance assessment across property types and geographies.
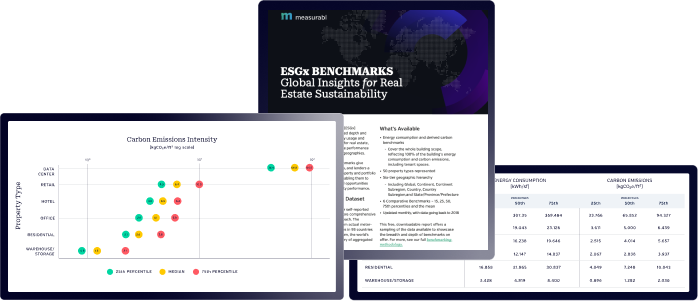
2023 Global Benchmarking Quartiles
ENERGY CONSUMPTION
(kWh/ft2)
CARBON EMISSIONS
(kgCO2e/ft2)
Property Type
Percentile
Percentile
25th
50th
75th
25th
50th
75th
Data Center
200.828
322.123
364.680
36.377
66.770
94.511
Hotel
15.462
18.926
22.910
3.602
4.903
6.389
Office
13.360
16.692
20.282
2.605
4.109
5.794
Residential
10.046
12.244
15.042
2.097
2.930
4.034
Retail
16.960
22.314
34.387
4.271
6.436
10.005
Warehouse/Storage
3.473
5.005
8.510
0.899
1.293
2.057
ESGx Benchmarks leverage actual meter-level data to deliver critical insights for real estate owners, operators, investors, and lenders. Our benchmarks help you understand and manage the risks and opportunities associated with sustainability performance.
Transparency is a key priority in our approach to benchmarking, because we understand the importance of having confidence in the inputs that drive real estate decision making. That’s why we openly share the parameters and logic behind our benchmarking datasets.
Annual energy use intensity (EUI) for each building is determined by aggregating monthly energy usage values.
Annual carbon emissions intensity (CEI) is calculated at the meter-reading level by applying corresponding, location-based emissions factors.
Our data quality specifications filter for outliers, and require buildings have measured utility data, adequate data coverage, tenant meters, and electric meters.
Measurabl creates benchmarking cohorts at the most granular property and location levels. Benchmarking cohorts are subject to specific building and customer counts, which ensure both data anonymity and large enough underlying distributions.
Jamestown and Boston Properties are on the vanguard of real estate sustainability. Hear what Becca Timms and Ben Myers have to say.
Get A Free Report
The Insights You Need
Don’t wait—the time to start benchmarking is now. Whether you’re an owner, operator, investor, tenant, or other stakeholder, ESGx Benchmarks provide critical insights needed to better understand and manage the risks and opportunities inherent in building sustainability performance.
Want to see more? Claim a free ESGx Benchmarks report today.
In collaboration with USGBC California, Measurabl’s Mike Zatz shares how building owners can navigate the growing complexity of benchmarking and building performance standards (BPS)